Data
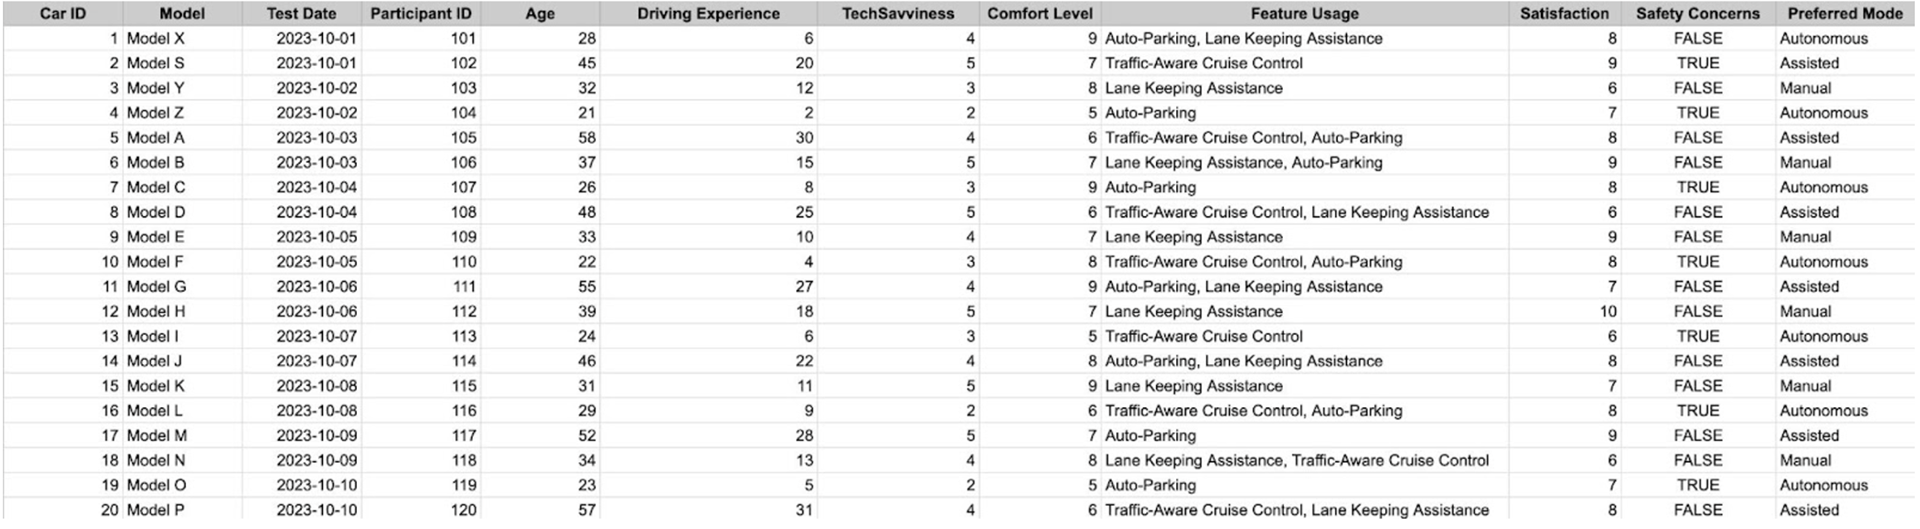
Exploring Data Attributes
Three attributes that I have chosen to look at from the data set are Participant ID, Driving Experience and Satisfaction. Participant ID is an example of a nominal data type. This is because the ID is just a label given to each participant for identification and has no ranking. Driving Experience is an example of a ratio data type. This is because a true point zero with equal distance between values allows us to rank and perform statistical analysis on the data. Lastly, we have Satisfaction which is an example of an ordinal data type. This is because the data can be ranked and sorted but there is a lack of insight and consistency into the difference between rankings and not being able to perform statistical analysis on it.
Consider how the level of tech savviness might influence satisfaction with autonomous car features among participants aged 30 and older. Identify what you believe is the independent/dependent variable in this scenario and explain your choice.
I think it is fair to assume and draw a conclusion on a participant's satisfaction rate with autonomous car features based on their tech savviness. We could make inferences that someone better with technology would have a much easier time navigating and working with autonomous cars and features. This in turn would make it so that they prefer and like the experience a lot more due to how easy it is for them and maybe not how easy it is for the general person. On the other hand, a person with less tech savviness may struggle with the autonomous car features and be less satisfied with the experience as a whole. Due to these cases, I would believe that tech savviness would be the independent variable as it is the one being manipulated and we are looking for the effects as it changes. Since we are looking for a change in the satisfaction data that would be our dependent variable in this scenario.
Hypothesis Testing
Scenario 1: Suppose the NHST results in a p-value equal to 0.0324. Explain what it means in the context of investigating the influence of age on safety concerns.
In this scenario, we would have our null hypothesis and our alternate hypothesis. Since the null hypothesis helps consider that there may not be any correlation or impact between our two variables for this scenario it would be that: Age does not influence safety concerns about autonomous cars. Our alternate hypothesis would be the opposite: Age does influence safety concerns about autonomous cars. The p-value in studies helps us build a case and argue against our null hypothesis and for our alternate hypothesis. A p-value ≤ 0.05 means there is strong evidence against the null hypothesis. A p-value of > 0.05 means insufficient evidence exists to reject the null hypothesis. In our case the NHST results in a p-value of 0.0324 < 0.05 meaning that our null hypothesis is rejected and there is sufficient evidence that age plays a factor and influences safety concerns about autonomous cars.
Scenario 2: Imagine a study investigating whether Comfort level influences participants' satisfaction scores about autonomous cars. Suppose the NHST results in a p-value equal to 0.0774. Explain what it means.
Again in this scenario, we would have our null hypothesis and our alternate hypothesis. Since the null hypothesis helps consider that there may not be any correlation or impact between our two variables for this scenario it would be that: Comfort level does not influence participants' satisfaction scores. Our alternate hypothesis would be the opposite: Comfort level does influence participants' satisfaction scores. The p-value in studies helps us build a case and argue against our null hypothesis and for our alternate hypothesis. A p-value ≤ 0.05 means there is strong evidence against the null hypothesis. A p-value of > 0.05 means insufficient evidence exists to reject the null hypothesis. In our case the NHST results in a p-value of 0.0774 < 0.05. This is crucial in this case as the data collected and analyzed in the NHST is not conclusive and/or sufficient to help us reject the null hypothesis. For the study, it means that we can not concretely say whether comfort influences participants' satisfaction scores.
Investigating AI Perception Data

We are given a data set showing survey data from 20 older adults and their perception of AI. From this data, our goal is to propose a method that answers the question, “How useful do older adults perceive the use of AI in their lives?” To start this analysis I will first look at the types of data from the survey that seem interesting and or useful to me:
Hour of Interactions with AI Per Week
Type: Ratio Data
I found this interesting because it’s interesting to me how much people interact with AI throughout the week and are aware of it. Looking deeper into this may allow me to draw comparisons and or insights into the lives of the people in the survey.
Perceived Usefulness of AI
Type: Ordinal Data
I found this data interesting as it was the main point of the study. Anything hypothesis that I would look to answer would include this data so it is important to have it.
Hypothesis: There is an increase in the perceived usefulness of AI in the lives of those older adults who interact with AI more throughout the week compared to their less interactive counterparts.
An experiment I could run to look to get insights and answers to my hypothesis is a correlational experiment. A correlational experiment is used to determine the amount and length of relationship between two variables. It helps to recognize trends and patterns in the data and to figure out how the two variables affect each other if at all. From our two pieces of data from the survey, we can highlight our dependent and independent variables:
Independent Variable: Hour of Interactions with AI Per Week
Dependent Variable: Perceived Usefulness of AI
This experiment would set us up to get an answer to our hypothesis. The independent variable would increase or decrease based on the participant and we would look at the associated dependent variable to see if a pattern is forming. My hunch is that the more that people use AI in their daily life be it for school, work, or just experimenting, their perceived usefulness of AI will also increase. We could also set up a null and alternate hypothesis to support this experiment.
Null Hypothesis: There is no relationship between the number of hours older adults interact with AI per week and their perceived usefulness of AI.
Alternate Hypothesis: There is a relationship between the number of hours older adults interact with AI per week and their perceived usefulness of AI.
From here we can also use a p-value to gain insight into if we can confidently accept or reject our null hypothesis. If I were to carry out this experiment I believe this discussed framework would give me great insight into my hypothesis and set me up for success in learning more about quantitative research methods.